144 years of marriage and divorce in 1 chart
I've always been curious about the history of marriage and divorce in the United States. We often hear about how divorce rates are in flux, or how marriage rates are declining, but we're rarely given a real sense of the long-term trends in marriage and divorce. Since I couldn't find a chart showing the long-term marriage and divorce trends in the U.S., I decided to crawl through the CDC's National Center for Health Statistics (NCHS) database and collect the data myself.
If you're not familiar with the NCHS, they publish monthly reports on vital statistics about Americans such as birth rates, death rates, causes of death, and -- you guessed it -- marriage and divorce rates. Most of the historical data is hidden away in PDFs of these monthly reports, so I had the pleasure of scraping data from scans of dozens of CDC reports that were published 30 years before I was even born. I'll save you the laborious effort of repeating my scraping efforts by sharing the data set here.
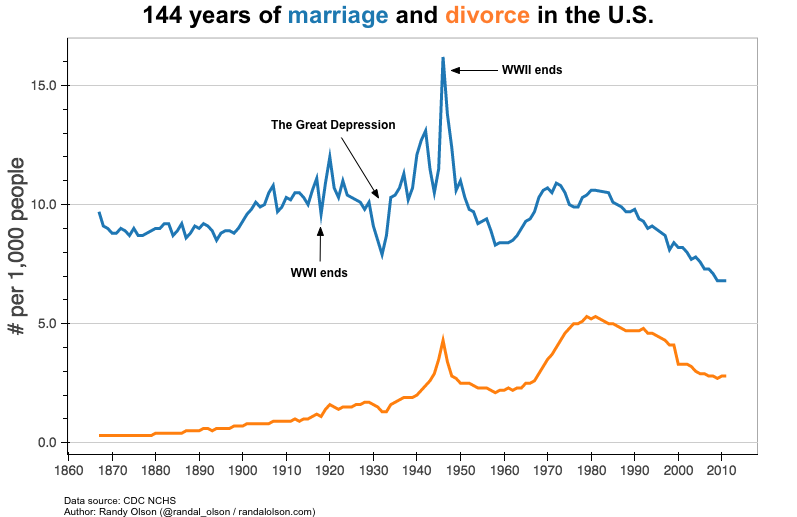
To provide a more visual view of the data set, I charted the per capita marriage and divorce rates below, with a few annotations to denote major historical events.
It's fascinating to see the effects of WWI and WWII on marriage and divorce rates in the United States. At the beginning of America's entry into WWI (1917) and WWII (1941), we see notable spikes in marriage rates as the young conscripts rushed to the altar thinking it would be the last time they would see their lover.
Similarly, after the conclusion of WWI (1918) and WWII (1945), those same young men and women coming back from the war seemed eager to elope and start a new life after spending years experiencing the destructive nature of war. Interestingly, the only notable spike in divorce rates in the past 144 years also followed the conclusion of WWII, likely due to many of the pre-WWII marriages coming to an abrupt end once the romance of wartime marriage wore off.
The most notable drop in marriage rates occurred during The Great Depression in the early 1930s, with a sudden 25% drop in marriage rates during America's greatest time of hardship. It seems when Americans fall on hard times, marriage is one of the first things to take the back seat.
One particularly confusing aspect of this data set was the fact that the post-war era in the 1950s and 1960s seemed to experience a significant drop in marriage rates, despite the fact that the 1950s and 1960s were known as a time of nearly-universal marriage in the U.S.
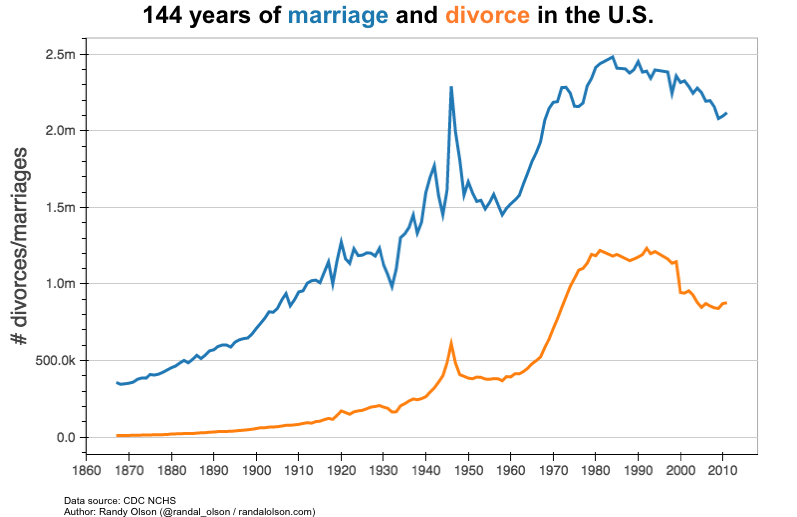
To provide a clearer view of the 1950s and 1960s, I plotted the raw counts for marriages and divorces below.
With the raw counts in hand, the explanation for the drop in per capita marriage rates becomes abundantly clear: People weren't marrying less in the 1950s and 1960s, but the surge of newborn children during the Baby Boom artificially decreases the per capita rates. Once the Baby Boomers came of age in the 1970s, marriage rates returned to pre-WWII levels -- barring a slight drop in marriages during the dramatic conclusion of the Vietnam War (1975).
Looking to more recent history, there has been a steady decline in marriage rates (and consequently, divorce rates) since the 1980s, with no sign of slowing down. In fact, when taking population into account, marriage rates in the U.S. are now at the lowest they've ever been in recorded U.S. history -- even lower than during The Great Depression!
If you think you know why marriage rates have been declining in the U.S. since the 1980s, I'd be curious to hear your theories in the comments.

