Dr. Randal S. Olson
I’ve worked in AI for 15+ years, starting in research and moving into applied work and company building.
I’m co-founder and CTO of Goodeye Labs, where we build AI products that point frontier models at the business outcomes a team actually cares about.
On the side, I write about data science and AI. Past projects include TPOT (an early AutoML tool) and using AI to compute the optimal U.S. road trip.
Selected work
Projects and tools I’ve built.
A mix of research software, data visualizations, and the current focus at Goodeye Labs.
Goodeye
Goodeye Labs' product. Build AI workflows paired with verifiers that keep an agent’s output pointed at the business outcome that actually matters.
Goodeye Labs
Teaching an AI Agent to Make Beautiful Charts
A running series where an AI agent makes data visualizations, the Tufte Test scores them, and the scoring criteria stay in public view.
blog series
TPOT: Automated Machine Learning
A Python AutoML tool that optimizes ML pipelines using genetic programming. Built on scikit-learn and cited thousands of times.
open source
Optimal U.S. Road Trip
Used a genetic algorithm to solve the traveling salesman problem across all 50 U.S. states. 13,699 miles of optimal driving, and replicated for dozens of countries since.
data viz
Women in STEM: The Data Story
Visualized gender distribution across U.S. college majors from 1970 to 2012, surfacing the engineering gap.
data viz
Name Age Calculator
Predicts age from a first name using Social Security baby-name data and actuarial tables. Based on FiveThirtyEight’s methodology.
interactive tool
Writing
Recent writing.
Data science, AI, data visualization, and the occasional history deep dive. I write for people who want the analysis and the takeaway, not a lecture.
Latest
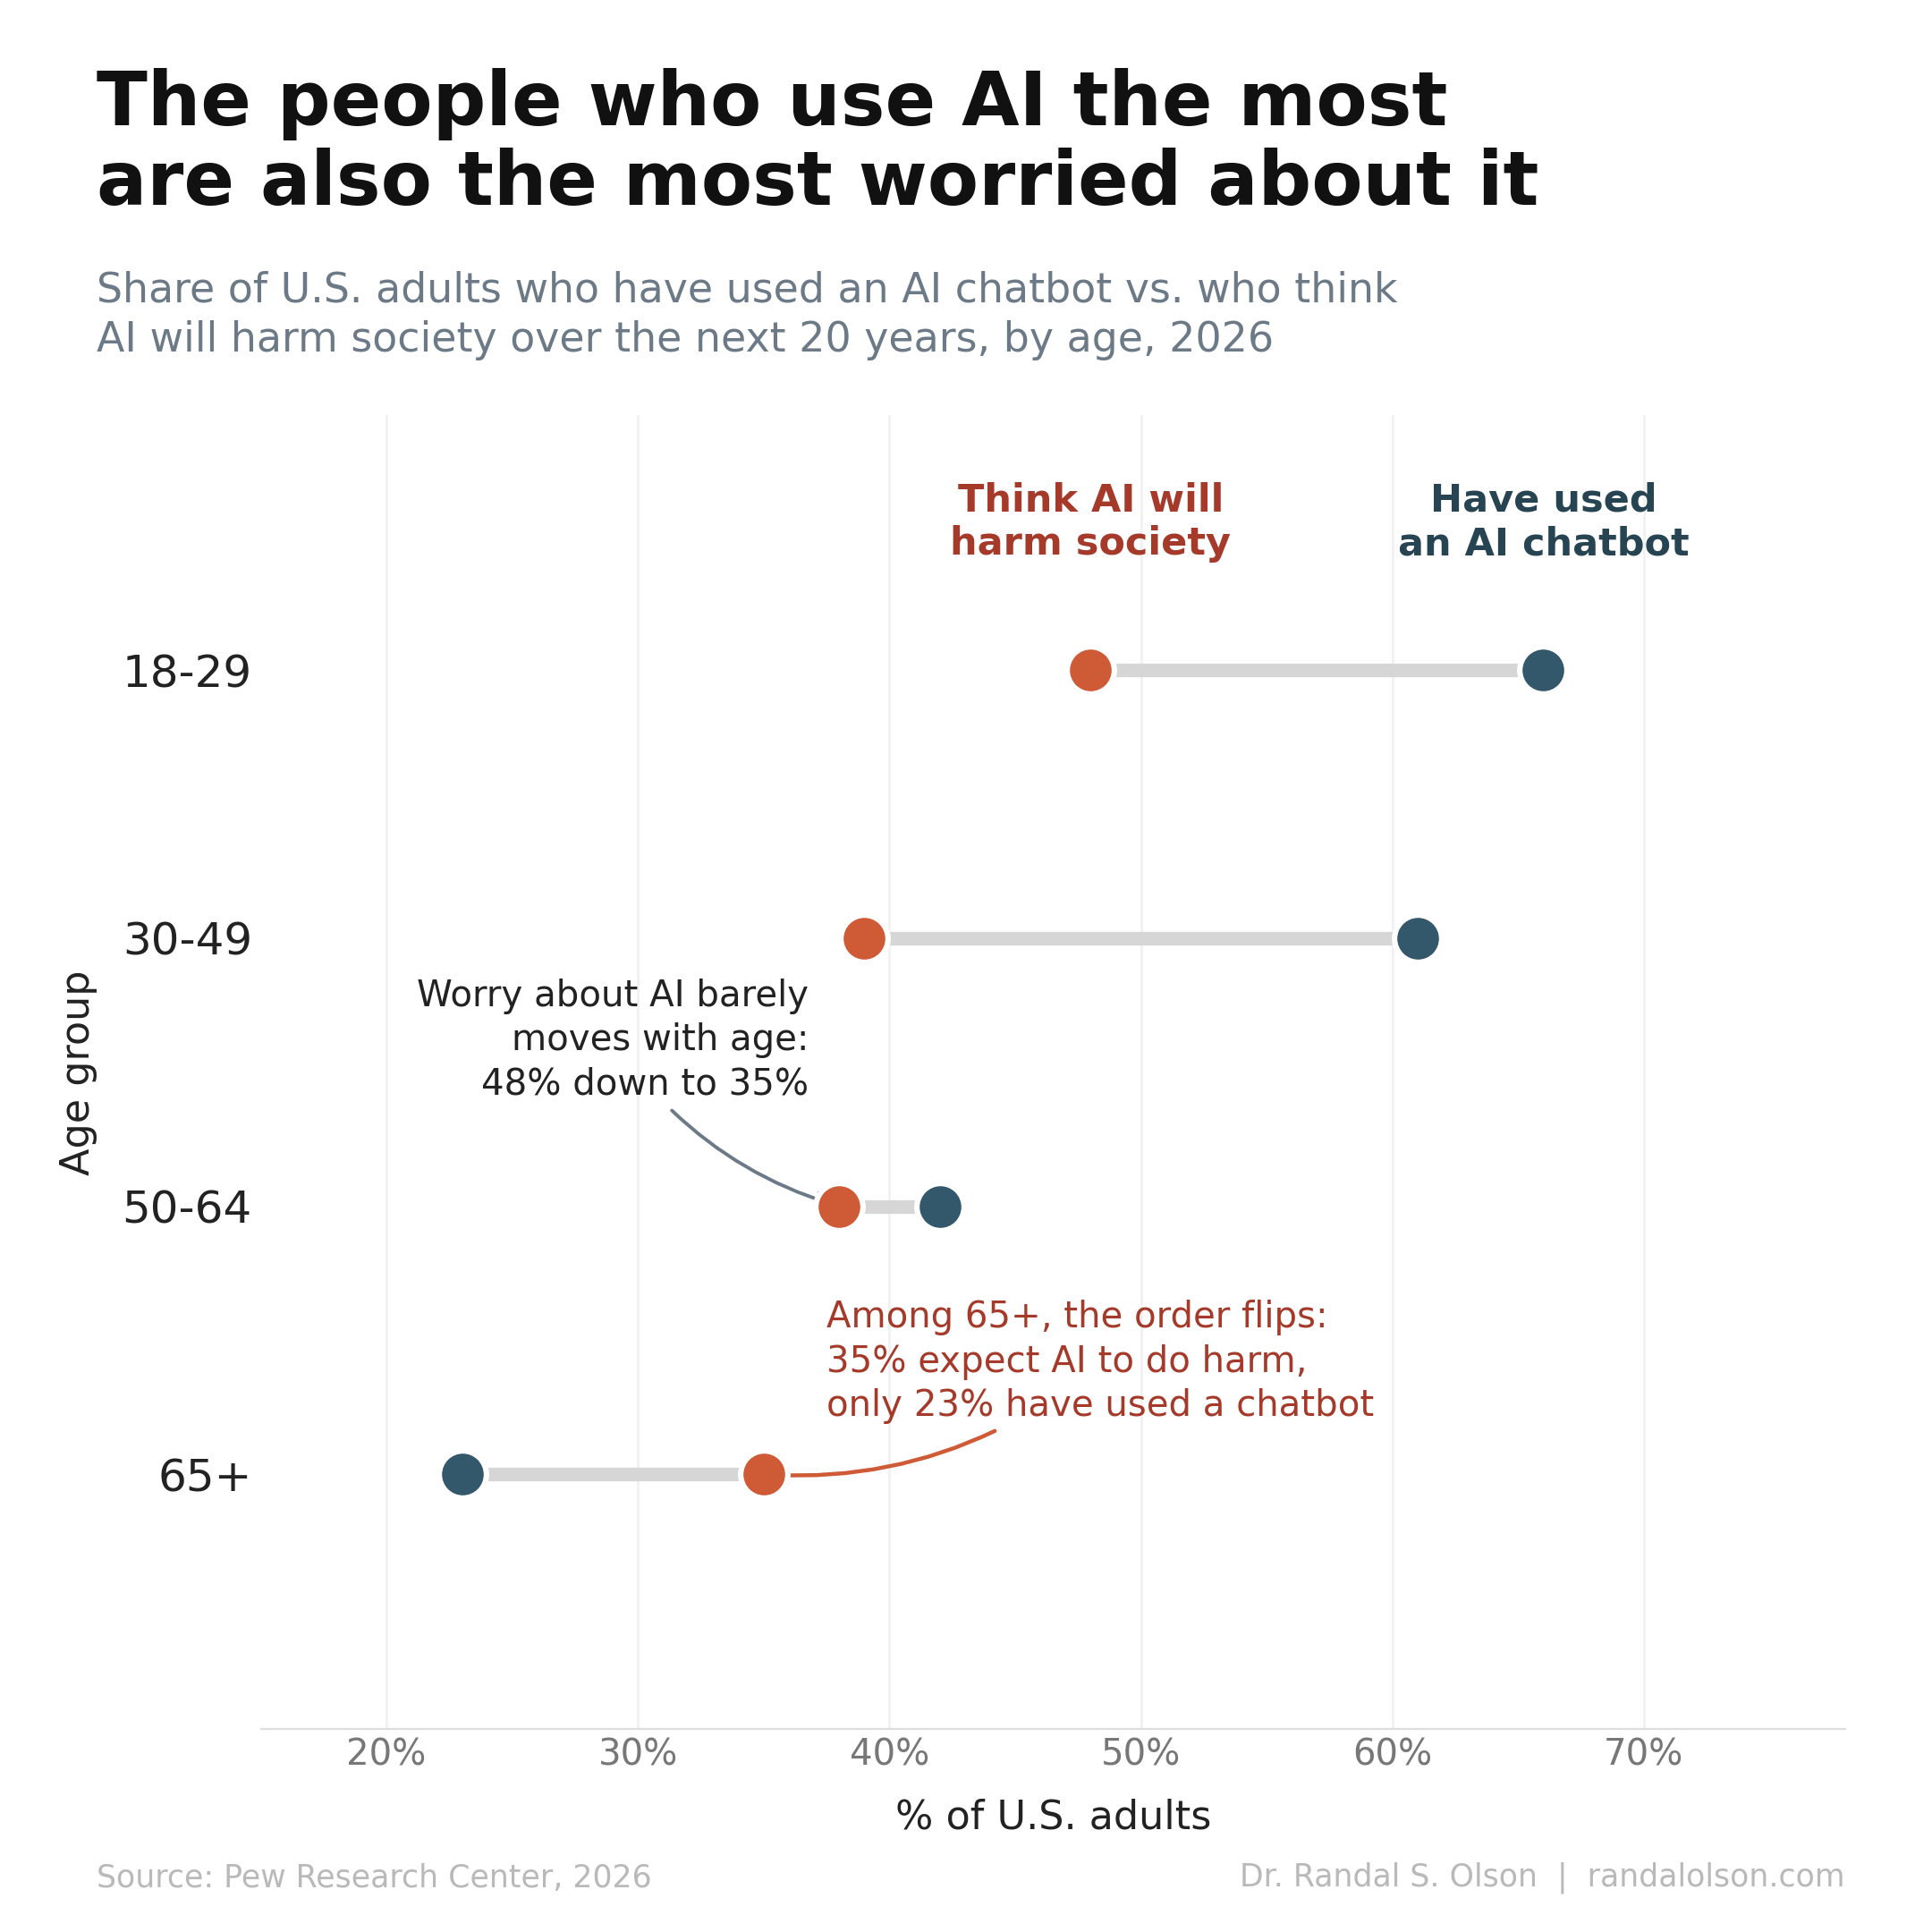
The people who use AI the most are also the most worried about it
Pew's 2026 data shows the youngest U.S. adults use AI chatbots the most, yet they are also the most likely to expect AI to harm society.
- 6 min
In AI-exposed jobs, only the youngest workers are losing ground
Since ChatGPT, employment for U.S. workers aged 22 to 25 in the most AI-exposed jobs has fallen about 12%, while every older age group held steady or grew.
- 7 min
The Strait of Hormuz is Asia's oil lifeline, not the U.S.'s
As the 2026 Strait of Hormuz crisis stoked U.S. oil fears, only about 7% of U.S. crude imports actually pass through it. Asia relies on it far more.
- 5 min
The world's richest person has never been this far ahead of No. 2
Elon Musk became the world's first trillionaire on June 12, 2026. His fortune is now about 3.7x the second-richest person, the widest gap on record.
- 5 min
The 2026 NBA Finals drew the biggest TV audience since 1998
The 2026 Knicks-Spurs Finals averaged 20.6 million viewers, double last year and the most since 1998, reversing a long slide in NBA TV ratings.
- 4 min
GLP-1 use peaks in middle age, then drops at 65
About 1 in 8 U.S. adults now take a GLP-1 like Ozempic, but use peaks in middle age: 22% at ages 50-64, falling to 9% at 65+ as Medicare stops covering it.
- 6 min
U.S. abortions rose after Dobbs, driven by mailed pills
Dobbs was supposed to cut U.S. abortions. It did not. The national total rose after 2022, and the whole increase is telehealth: abortion pills by mail.
- 5 min
ICE detention hit a record, and most detainees have no conviction
U.S. immigration detention hit a record 70,000+ people in early 2026, and TRAC data shows about 7 in 10 detainees have no criminal conviction.
Background
About me.
The short version: 15+ years in AI, starting in research and moving into applied work and company building.
I did my Ph.D. at Michigan State in computer science, focused on evolutionary algorithms and the evolution of intelligence, and then a postdoc at Penn. After that I spent years on applied ML and AI strategy, most recently as Head of AI Strategy at AE Studio.
Outside of work, I write about data science and AI here. A few of those projects found an audience beyond the blog: TPOT (AutoML), the optimal U.S. road trip, and a widely-shared visualization of gender distribution across U.S. college majors. Over the years, various bits of my writing have been covered by the New York Times, Washington Post, Wired, and FiveThirtyEight.
These days, most of my time goes to Goodeye Labs. Frontier AI can do almost anything, but most teams can't get it pointed at the outcome they actually care about. We’re building products to fix that.
- Based in
- Anacortes, WA
- Role
- Co-founder & CTO, Goodeye Labs
- Ph.D.
- Michigan State University, 2015
- Publications
- 50+ peer-reviewed, ~6,600 citations
Contact
Get in touch.
If you want to work together, talk shop about AI, or nerd out about something specific, drop me a line. Email is best.