Americans used to outlive their peers. Now they die 4 years sooner.
Part of Teaching an AI Agent to Make Beautiful Charts
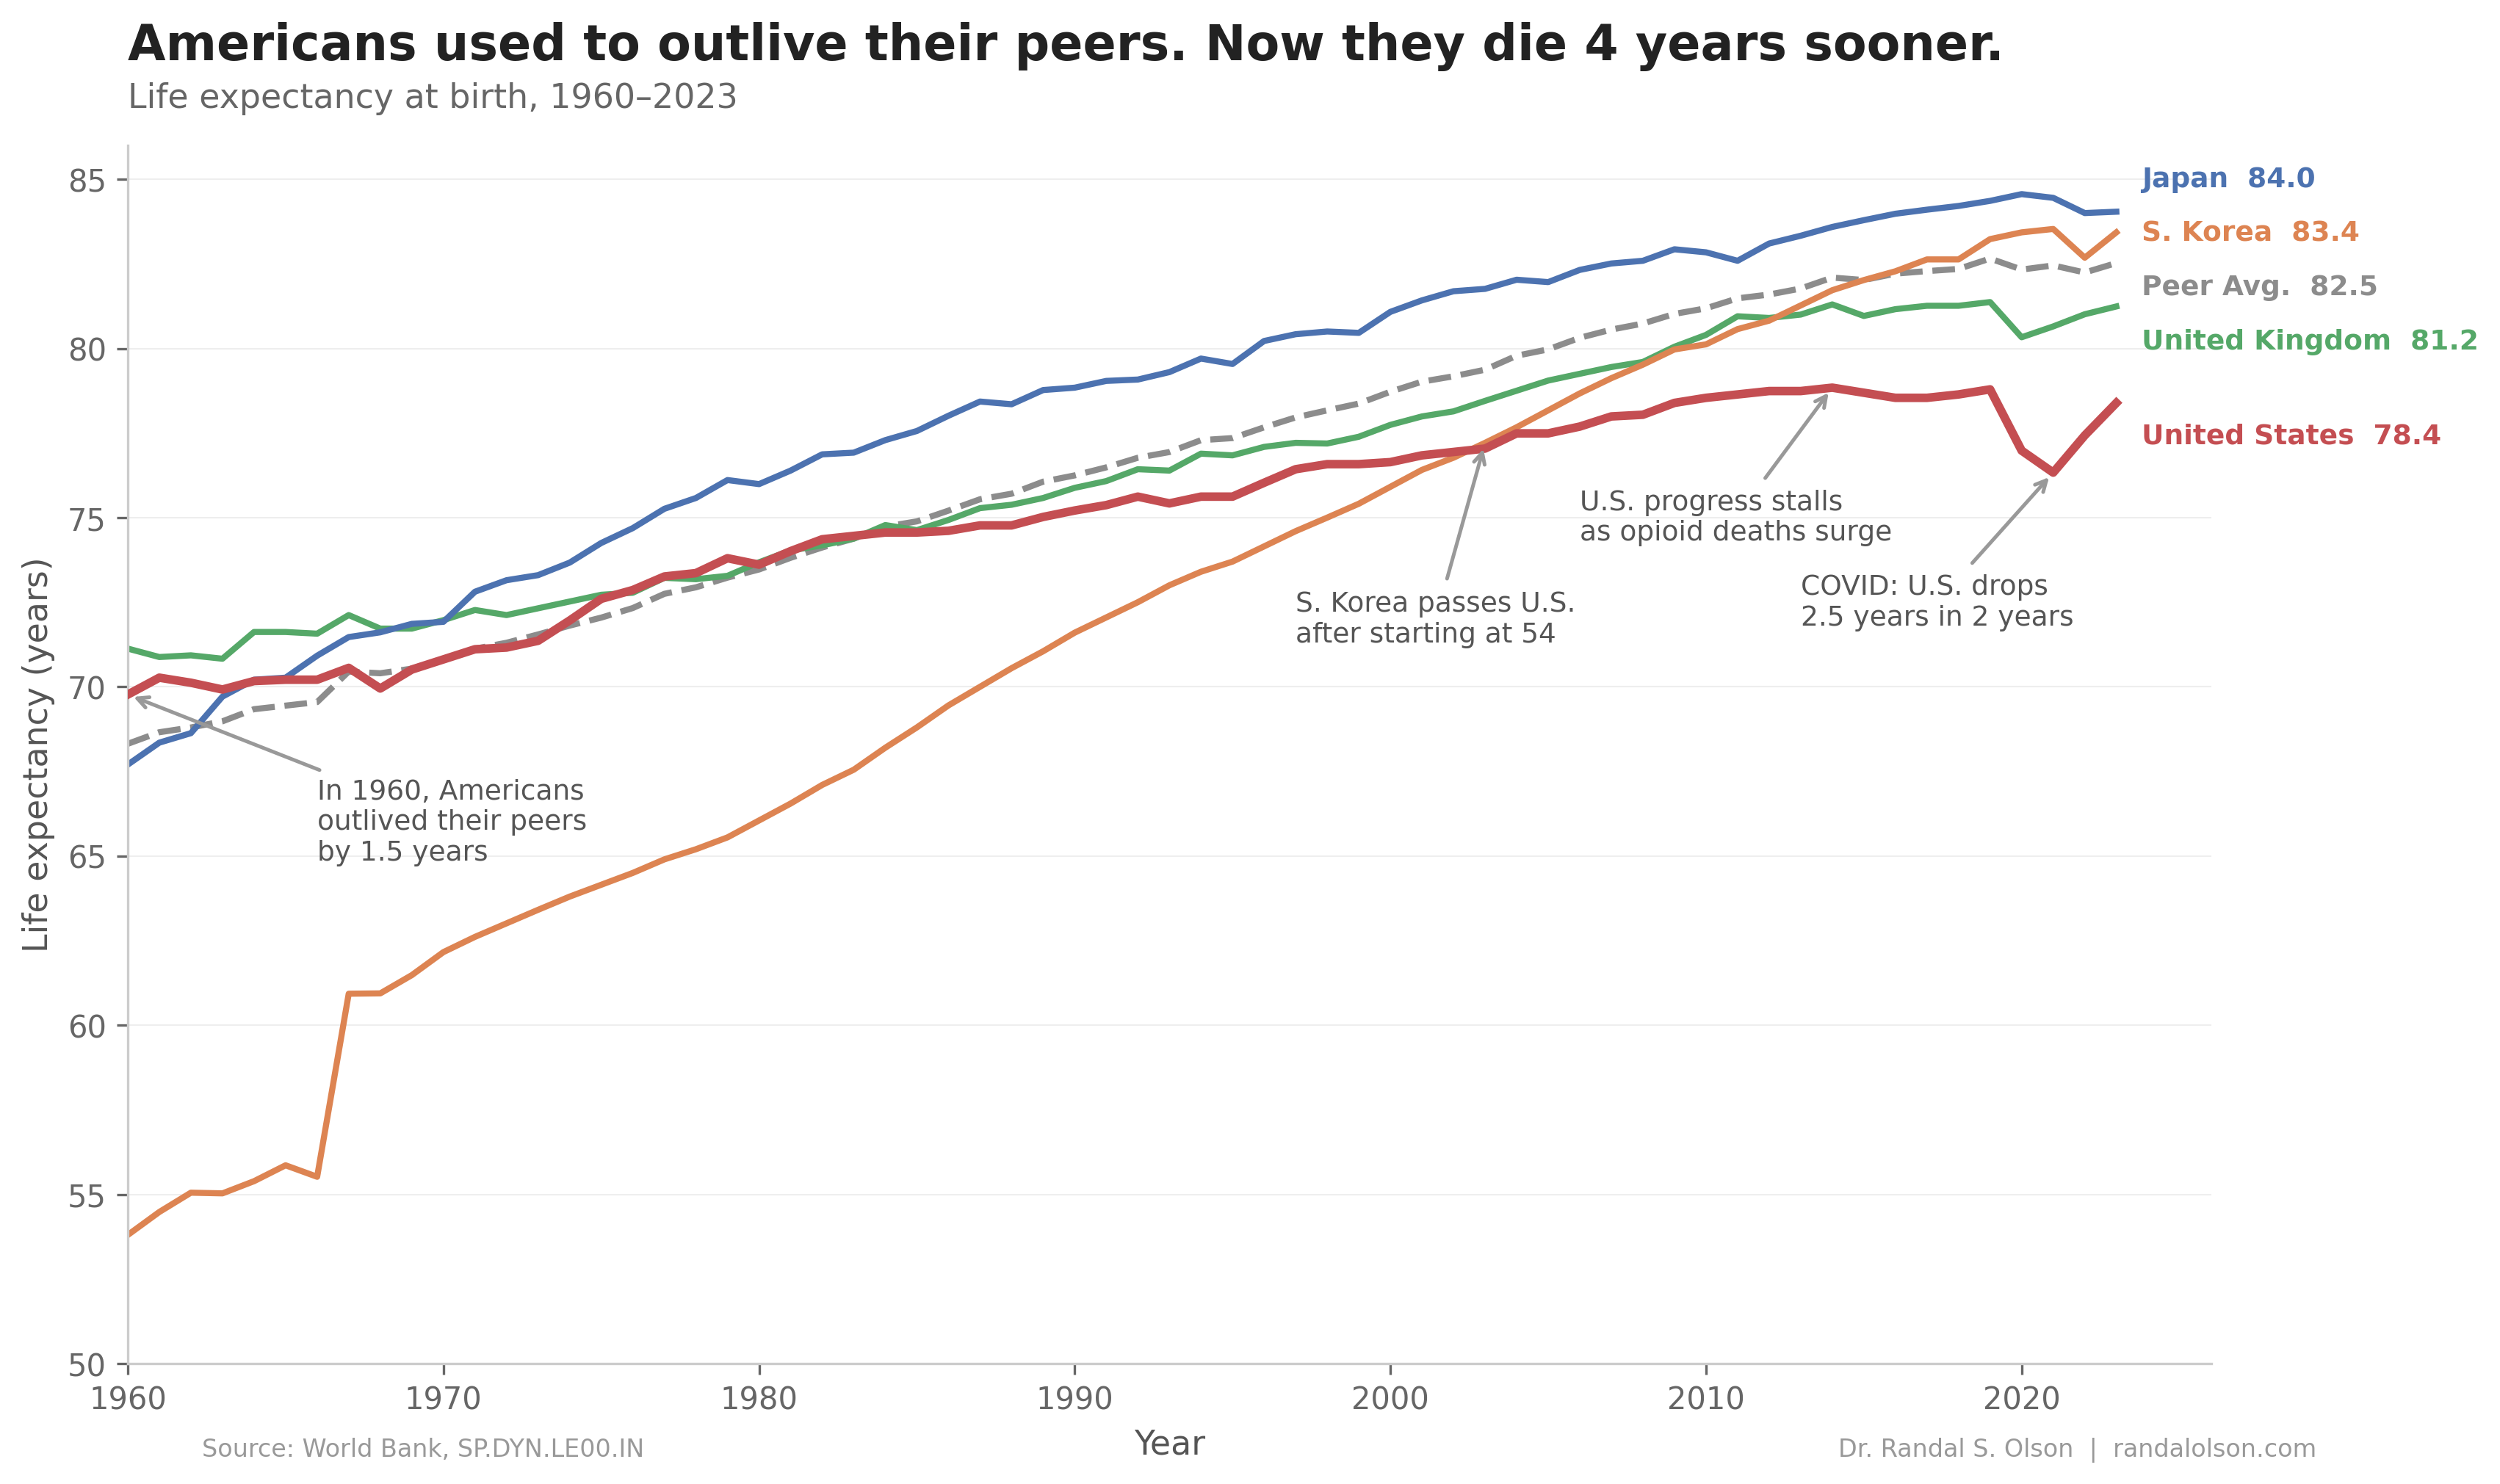
Here's a stat that should stop you cold: in 1960, the average American outlived their counterparts in Japan, the U.K., South Korea, and other wealthy nations by a year and a half. By 2023, that lead had flipped into a 4-year deficit. I pulled 64 years of World Bank life expectancy data and pointed an AI agent at it to chart the divergence.
The U.S. started ahead and fell behind
In 1960, U.S. life expectancy was 69.8 years, 1.5 years above the peer average of 68.3. That lead narrowed through the 1970s and vanished by around 1980. From there, the gap reversed and kept widening. A 2023 study in the American Journal of Public Health traced the slowdown as far back as the 1960s, when U.S. gains in heart disease mortality began lagging behind Europe and Japan.
The causes are structural: higher obesity rates, no universal healthcare, more gun deaths, and more car fatalities than peer nations. Our World in Data's analysis calls it a "pervasive disadvantage" spanning dozens of causes of death, not a single smoking gun.
South Korea started at 54 and blew past the U.S.
In 1960, South Korean life expectancy was just 53.8 years, 16 years below the U.S. By 2003, South Korea had caught up and passed the U.S. entirely. By 2023, the gap had flipped to 5 years in Korea's favor (83.4 vs. 78.4). The speed of that convergence is staggering: South Korea gained nearly 30 years of life expectancy in six decades while the U.S. gained fewer than 9.
South Korea's rise tracks closely with its rapid industrialization, expansion of universal health insurance in 1989, and one of the lowest obesity rates among wealthy nations. It's a powerful counterpoint to the idea that the U.S. trajectory is somehow inevitable for rich countries.
Opioids froze U.S. progress for a decade
From 2010 to 2019, U.S. life expectancy barely budged, stuck between 78.5 and 78.9 years while peer nations kept climbing. The opioid epidemic is the clearest reason. Drug overdose deaths rose from 38,329 in 2010 to 105,007 in 2023, nearly tripling in just over a decade. A 2024 Lancet study estimated that opioid overdoses alone reduced U.S. life expectancy by 0.67 years in 2022.
The crisis came in three waves: prescription opioids like OxyContin through the 2000s, a heroin surge starting around 2010, then synthetic fentanyl dominating after 2013. The good news: CDC data shows overdose deaths dropped 27% in 2024, down to 79,384. Still an enormous number, but the first sustained decline in years.
COVID blew the gap wide open
Between 2019 and 2021, U.S. life expectancy dropped 2.5 years, from 78.8 to 76.3. Peer nations lost just 0.2 years on average over the same period. Japan barely moved at all, holding steady at 84.4. A study in the American Journal of Public Health found that U.S. losses disproportionately hit young and middle-aged adults: increases in deaths among 15-to-64-year-olds accounted for nearly half the decline. In peer countries, 88% of losses came from deaths over age 65.
The U.S. had roughly 1.7 million excess deaths between March 2020 and the end of 2022. By 2023, U.S. life expectancy had recovered to 78.4, and preliminary CDC data puts 2024 at 79.0. That's above the pre-pandemic 78.8, but the gap with peers remains wider than it was in 2019.
Japan leads by 5.7 years, and it's not genetics
In 2023, a Japanese newborn can expect to live to 84.0. An American newborn, 78.4. That's a 5.7-year gap. When Japanese people move to the U.S. and adopt American diets and driving habits, their obesity rates converge toward American levels. It's environment and behavior, not DNA.
The numbers tell the story. Japan's adult obesity rate is about 4%; the U.S. rate is 40%. Japan has had universal health insurance since 1961 and mandates annual employer health screenings. A 2020 study in the European Journal of Clinical Nutrition points to diet as the key differentiator: high fish and soy intake, low red meat, minimal sugar-sweetened drinks, and widespread green tea consumption have kept Japan's heart disease and cancer mortality far below Western levels.
How this chart was made
An AI agent built this chart end-to-end as part of the Beautiful Charts with AI series. It pulled the latest World Bank data, built the chart in Python, and iterated on the design until it passed the Tufte Test, a data visualization quality standard built by Goodeye Labs on Truesight.
Data source: World Bank, Life expectancy at birth (SP.DYN.LE00.IN). Peer nations in the average: Australia, Canada, France, Germany, Japan, South Korea, Sweden, and the U.K. The cleaned dataset is available here.
Tags
Related Posts

Dr. Randal S. Olson
AI Researcher & Builder · Co-Founder & CTO at Goodeye Labs
I turn ambitious AI ideas into business wins, bridging the gap between technical promise and real-world impact.