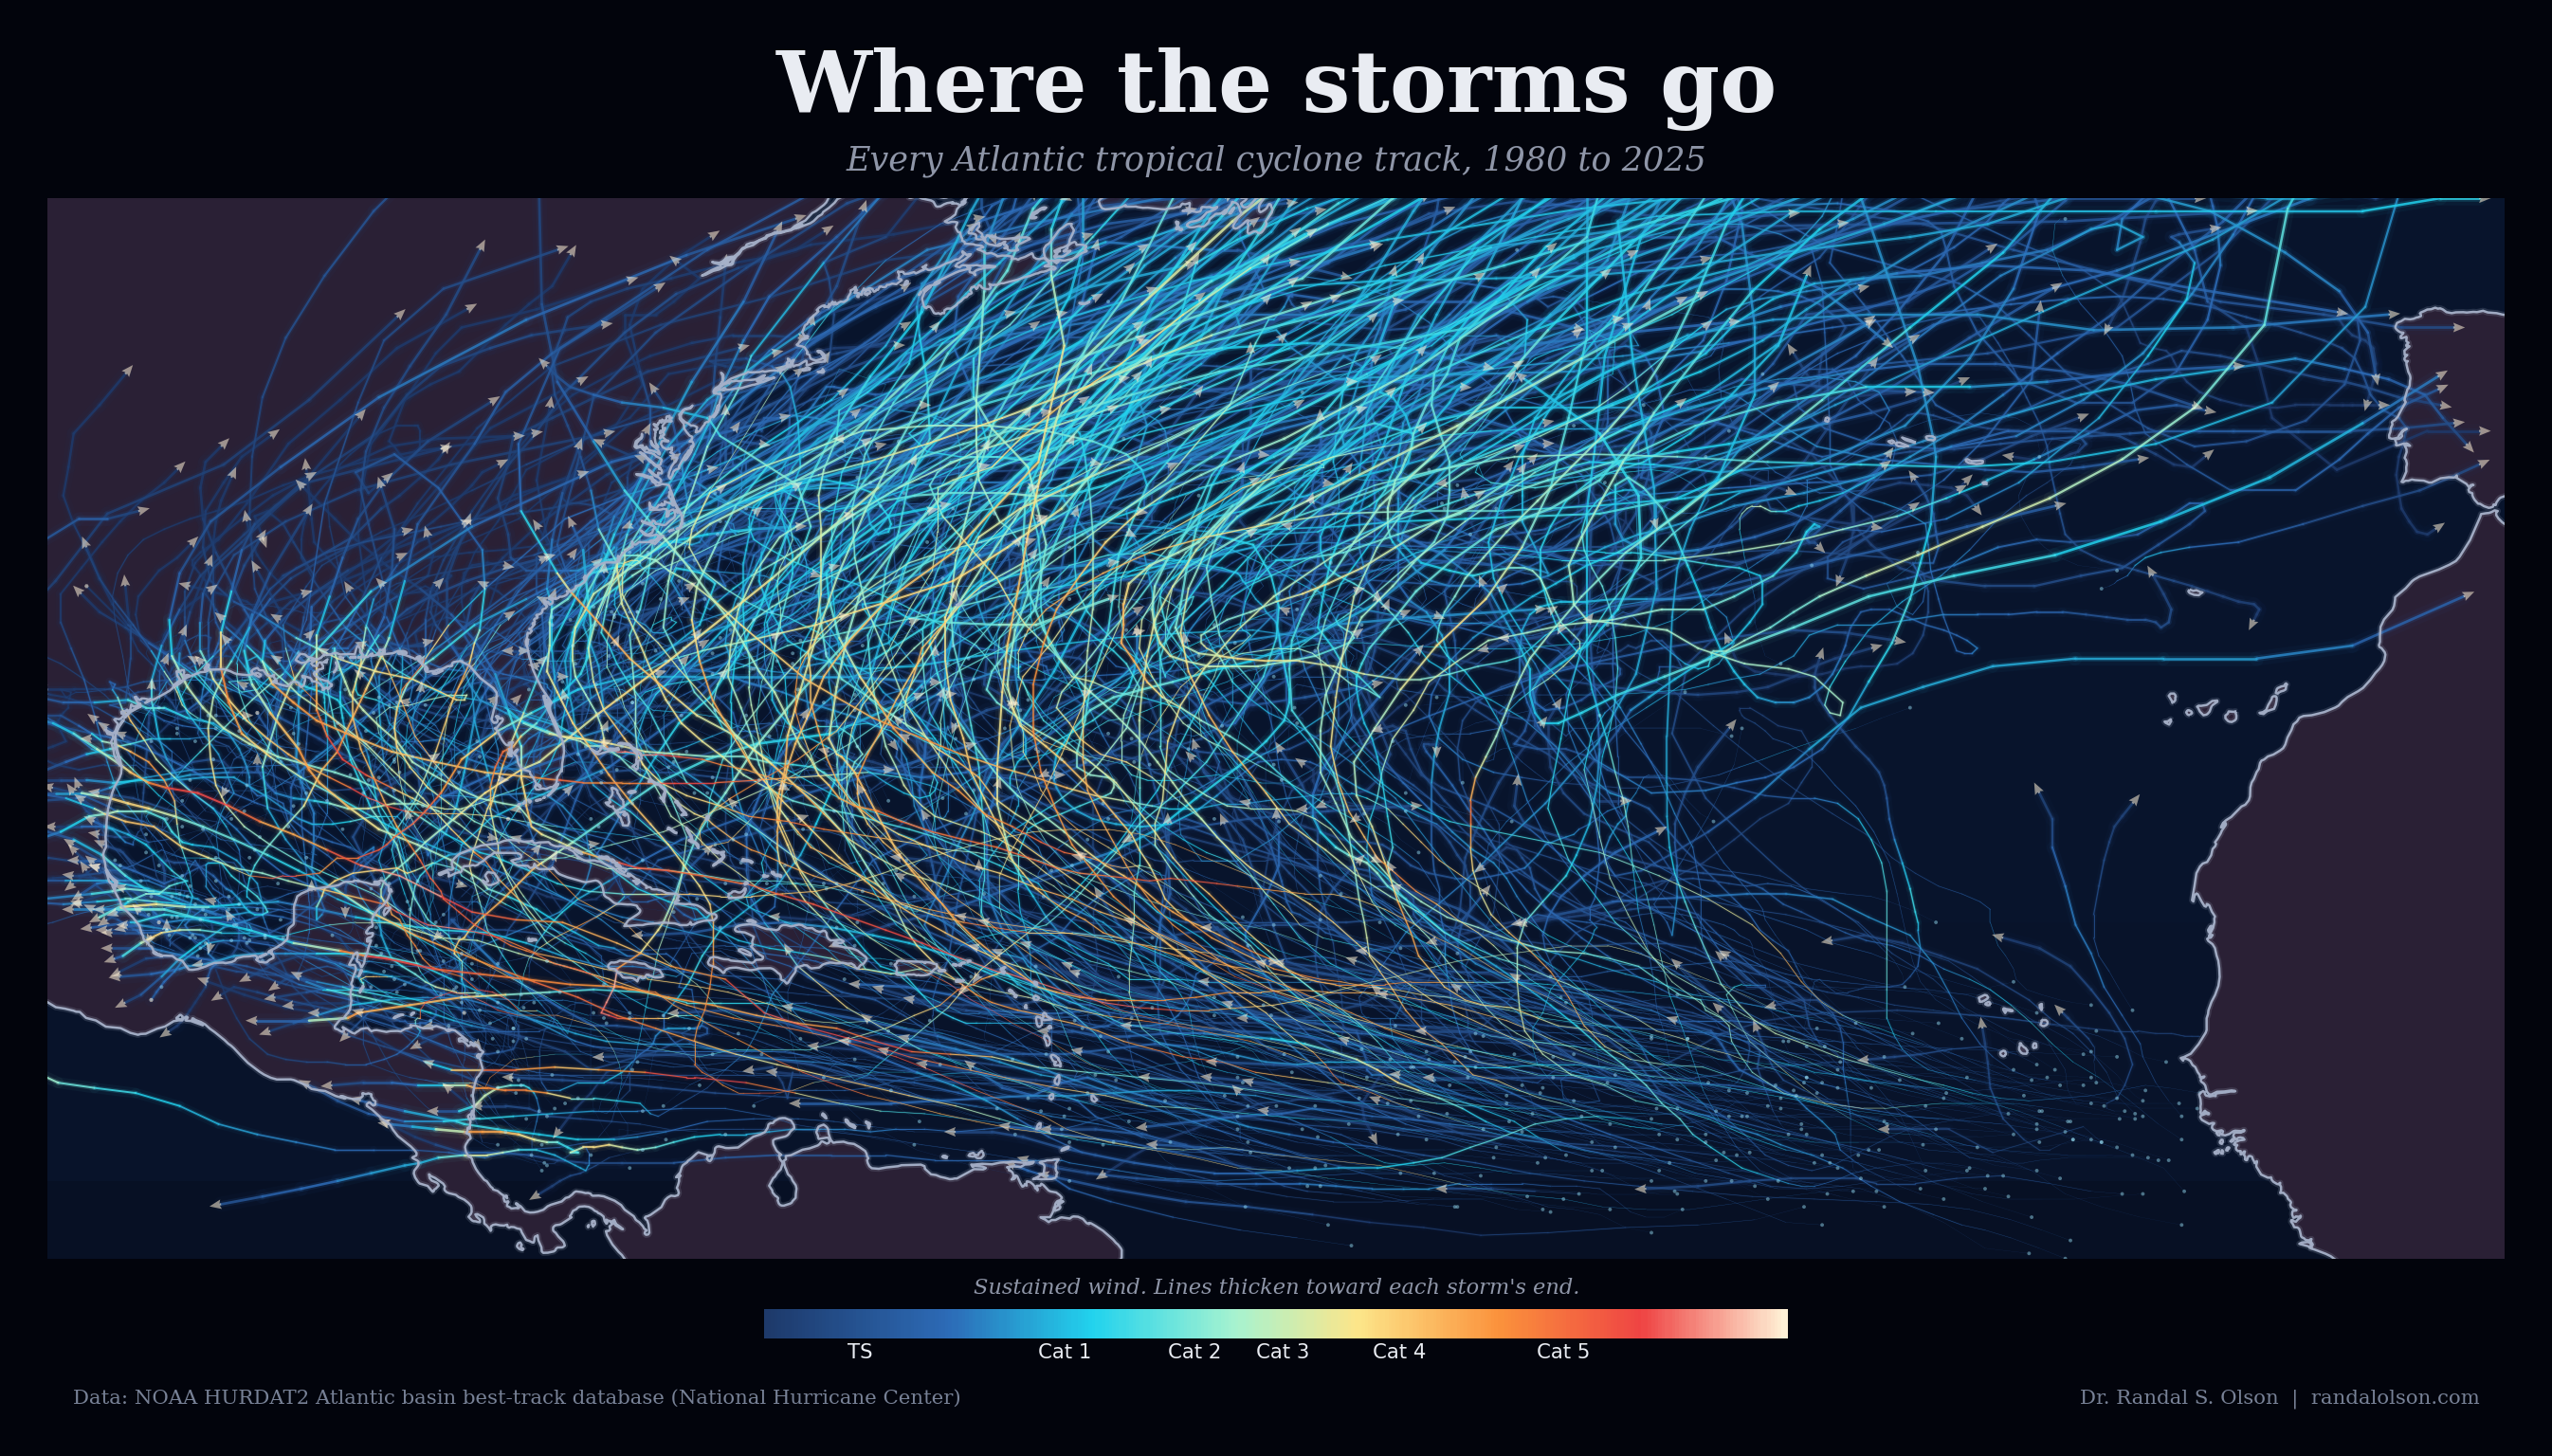
Every Atlantic hurricane track, 1980 to 2025
Part of Teaching an AI Agent to Make Beautiful Charts
Over the last 46 years the Atlantic has produced 738 named tropical cyclones. Every one of them has a track: a string of latitudes and longitudes logged at 6-hour intervals by the National Hurricane Center from the moment a storm is named until it dissipates. Plot all 738 on one map, color each segment by sustained wind, and the climate geography of the basin falls out of the mesh.
Hurricanes go where the warm water is
The tracks cluster in a few specific places: the Gulf of Mexico, the arc of the Caribbean, the stretch of open ocean east of the Lesser Antilles, and the sweep up the U.S. East Coast. The pattern is not random. Tropical cyclones form and intensify only over warm, deep ocean water, and the basin's warm water sits in a specific, repeatable configuration. The chart is effectively a 46-year average of that geography, drawn by every storm that used it.
The Gulf and the Caribbean are intensification chambers
Notice where the yellow, orange, and red pixels concentrate: inside the Gulf of Mexico, and along a stripe running from the northwestern Caribbean up toward the Bahamas. Warm, deep water with no continental shelf to disrupt it is the fuel a mature hurricane wants. Katrina (2005), Harvey (2017), Michael (2018), Ian (2022), and Milton (2024) all hit their peak intensities inside the Gulf. Wilma (2005) did the same in the northwestern Caribbean, and Hurricane Maria went from a Category 1 to a Category 5 in 24 hours in the eastern Caribbean before striking Puerto Rico in 2017.
Two storms share the modern record
The chart shows 26 Category 5 storms in 46 years. Two are tied for the strongest sustained winds measured in that span: Allen in 1980 and Melissa in 2025, both at 165 knots (about 190 mph). Allen ran the full Cape Verde route, hit that 165-knot mark three separate times between the Caribbean and the Yucatán Channel, and came ashore in south Texas. Melissa intensified just south of Jamaica and made landfall on the island as a Category 5, the strongest hurricane ever to strike Jamaica. On the chart, both tracks read as the thin red-into-white filaments that stand out against the blue majority.
The basin has 4 gears
Four patterns are easy to pick out in the mesh. Cape Verde storms form off the coast of West Africa and trace the long westward route across the Atlantic, usually curving north as the mid-latitude westerlies catch them. Gulf storms form closer to home, tend to be shorter-lived, and are often the ones that peak just before landfall. Caribbean storms have the shortest fuse: from formation to landfall can be 48 hours. The fourth gear is recurvature, the sweep of tracks that cross the southern U.S. coast or miss it, get caught in the westerlies, and head northeast along the East Coast before vanishing into the North Atlantic. Those are the storms that threaten the mid-Atlantic and New England.
How this chart was made
An AI agent built the chart end to end: parsing the HURDAT2 text format, filtering to the satellite era (1980 onward), rendering 738 storm tracks colored by sustained wind speed, and drafting the post. The work was iterated against the Tufte test, a data visualization quality standard built by Goodeye Labs on Truesight. For this piece the goal was beauty first, so the form privileges density and depth over strict minimalism. The source is the National Hurricane Center's HURDAT2 Atlantic basin best-track database, the authoritative record of Atlantic tropical cyclones maintained by the NHC and reprocessed by Chris Landsea's team. The cleaned CSV (21,335 track points across 738 storms) is available: atlantic-hurricane-tracks-1980-2025.csv.
Beautiful Charts with AI
Want to test your own charts against the same quality bar?
Try the Tufte Test on your own chart, or get future updates on AI evaluation and chart quality from Goodeye Labs.

Dr. Randal S. Olson
AI Researcher & Builder · Co-Founder & CTO at Goodeye Labs
I turn ambitious AI ideas into business wins, bridging the gap between technical promise and real-world impact.